I’ve conceived this project that I’m really excited about. In Information Security, we often focus on the engineering side of things. Maybe it’s because that’s what we’re most comfortable with. After all, many of us started in software engineering, so we understand their processes and perspectives. We know the pitfalls and pressures. But it’s also important to penetrate the product side of the house. Following the adage “Push left”, it really doesn’t get more left than product design. Before there’s code, before there’s data flow, before there’s architecture, there’s product requirements. There’s the identification of a gap in the business’s service offering and the very beginning of ideation to fill it.
It is at this early stage of product development that Information Security needs to get involved. From the very conception of a new service offering, Infosec needs to be in the room. This presents a problem with scaling though. New product are conceived all the time, but many die in early stages as needs shift and are prioritized. How can Infosec be everywhere while protecting capacity? How can Infosec deliver the most value to the business by focusing on the most impactful areas?
Secure Product Development Rhythm (SPDR) is meant to address this. It provides Product Leads with the processes and tools they need to build incredible and secure experiences. SPDR is tightly integrated into the product development lifecycle to ensure it is easily accessible and provides comprehensive coverage.
SPDR should grant the ability to give security requirements and guidance alongside product requirements. Information Security will be able to engage with the Product Leads at scale. For particularly high risk products, Information Security will get involved early and often to ensure security by design. For lower risk products, Information Security will set an appropriate cadence which maintains the customer’s confidence in the security of the Compass platform.
SPDR Web
It all starts by weaving a web. SPDR Web is self-service and allows a product lead to quickly identify:
- the overall level of risk in their product
- the contributing factors to the product’s risk
- the areas of risk in their new product
- and ultimately, the Infosec services required for the product to launch
Here’s how it’s done.
Questionnaire
First, the product lead completes a questionnaire about the product being developed. It is divided by contributing factors which affect the level of risk in the product.
These factors are:
- Data
- Authentication & Authorization, shortened to AuthN/Z
- Business Criticality
- Integrations
- Compliance & Legal
The answers to these questions carry a weight representing the amount of risk it introduces. For example, dealing with financial data is very risky, so that carries a weight of +2. Conversely, not dealing with any PII at all would reduce risk, so that carries a weight of -1.
The answers are computed into a score by factor. This computation normalizes the score by considering it a percentage of the maximum possible score for the factor.
For instance, the answers to the Data factor produce a raw score of 15, and the maximum possible score for the Data factor is 22. This gives a final score of 68% for the Data factor.
Questions and weights will be discussed in a later post. Part of the beauty of my design is that elements are loosely coupled. You are free to write as many or as little questions as you want. You can add risk factors, or take them away. You can change the weighting of answers. All have a minimal impact on the following steps.
Visualizing
The final scores of each factor are represented in a spider graph. This allows product leads to quickly understand how the factors contribute to the overall level of risk.
Example spider graphs:
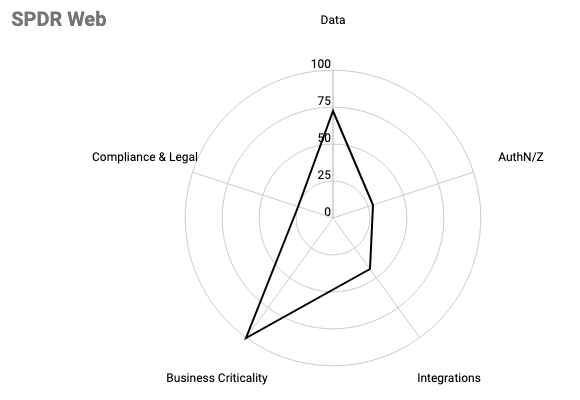
Graph of High Risk Product
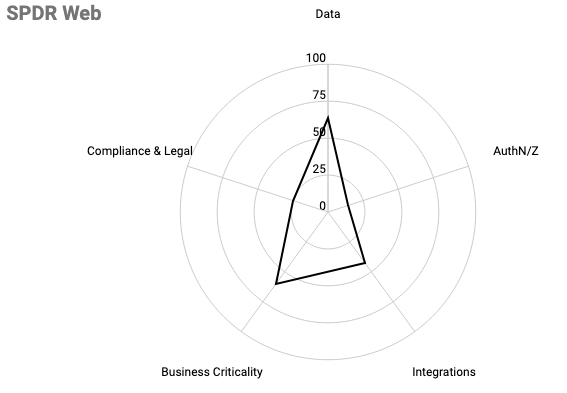
Graph of Medium Risk Product
The trouble with the spider graph is that it does not tell the product lead what the overall level of risk is. For that we need to translate the quantitative measurements into a more easily understood qualitative measurement.
Overall level of risk
The spider graph results in an irregular polygon which will then be used to determine the overall risk.
We do this by comparing the area of the graphed polygon to the area of the maximum sized polygon. This ratio is then mapped to a spectrum which translates the quantitative measurement into a qualitative one.
The area of the graphed polygon can be calculated by breaking it down into triangles, whose area is more easily discerned.
Consider this graph:
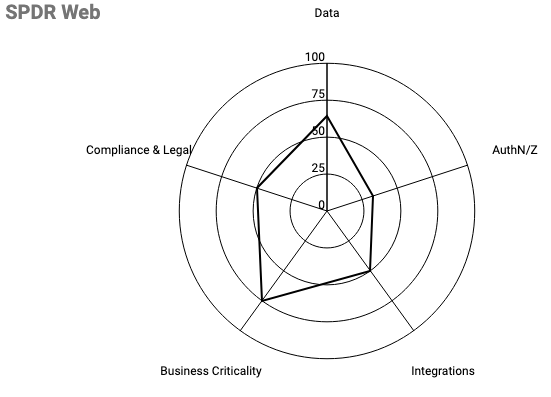
| Risk Factor | Percent |
| Data | 64% |
| AuthN/Z | 33% |
| Integrations | 50% |
| Business Criticality | 75% |
| Compliance & Legal | 50% |
We can calculate the triangle formed by the Data and AuthN/Z axes using the Side-Angle-Side method. Note that since there are 5 evenly spaced axes, the included angle is 360/5 = 72 and for ease of reading I’m going to replace the axes’ names with simply a, b, c, d, and e.
Area = 1/2*ab * sin(72)
Area = 0.64*0.33*sin(72)
Area = 10.04
We then do that for all triangles formed by all axes. The resulting formula would be:
area = 1/2*ab*sin(72) + 1/2*bc*sin(72) + 1/2*cd*sin(72) + 1/2*de*sin(72) + 1/2*ae*sin(72)Which can be refactored to:
area = 1/2*sin(72)*(ab + bc + cd + de +ae)In addition, the area of the maximum sized polygon would be determined by calculating:
area = 1/2*sin(72)*(1*1 + 1*1 + 1*1 + 1*1 + 1*1)Or simply:
area = 1/2*sin(72)*N
where N = axes in the polygon, 5
We set up the ratio by putting the formula for graphed polygon over the formula for maximum polygon:
ratio = (1/2*sin(72)*(ab + bc + cd + de + ae)) / (1/2*sin(72)*5)Which reduces quite nicely to simply:
ratio = (ab + bc + cd + de + ae) / 5Notice we are left with the sum of the products of adjacent axes divided by the number of axes.
It’s important to note that the order of the axes matters! Shuffling them around will change the area of the polygon, so mitigate this by using a consistent order and ensuring the neighboring axes are related.
At this point, we’ve reduced everything down to a single number, but that’s still a quantitative measurement that product lead’s would find difficult to action on. For this reason, the ratio is not shared with product leads. Instead, it is translated into a qualitative measurement.
It’s important to note for this next bit that since we’re using area, the differences get squared. Take for example a scenario where every factor was 50%, the resulting ratio would be 25% (which is 50% squared). If every factor was 25%, the resulting ratio would be 6% (which is 25% squared).
So, for the translation we cannot use a linear segmentation, we need to use an exponential segmentation.
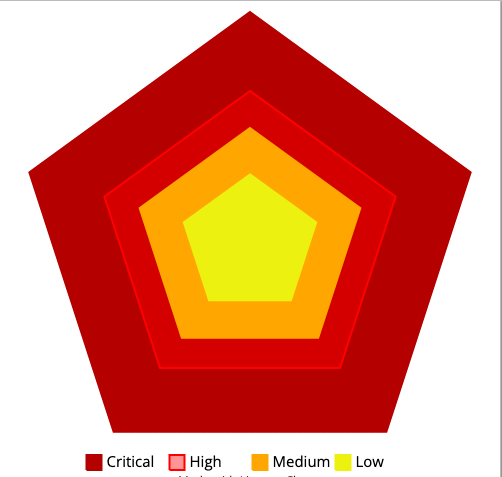
| Risk Level | Ratio |
| Critical | >= 45% |
| High | >= 25% |
| Medium | >= 10% |
| Low | >= 0% |
Which means we’re cutting the area roughly in half every time.